Sending FusionReactor Tracked Transaction Metrics To The Cloud Dashboard With Lucee CFML 5.2.9.40
One of the nice features of FusionReactor is that when you create a sub-Transaction with the FRAPI, you can graph that Transaction performance against the server's CPU and Heap profile. This helps identify correlations, bottlenecks, and performance opportunities. This works out-of-the-box with the Standalone dashboard. However, at the time of this writing, FusionReactor does not send sub-Transaction metrics to the Cloud dashboard automatically. In order to graph sub-Transaction metrics in the Cloud dashboard, you have to explicitly enable them in your ColdFusion code. This was not obvious to me; so, I wanted to demonstrate how this works in Lucee CFML 5.2.9.40.
ASIDE: I want to give a special shout-out to Michael Flewitt, a Support engineer at Integral (makers of FusionReactor), who spent no less than 3-hours working with me, helping me to figure how this code works (and why I wasn't seen then results that I expected to see). He is a true champion!
When you create a tracked-Transaction in your ColdFusion code, FusionReactor is implicitly logging six metrics about that Transaction's performance. So, for example, when you create a Transaction called demo-segment:
frapi.createTrackedTransaction( "demo-segment" )
... FusionReactor implicitly logs the following numeric-aggregate metrics:
/transit/txntracker/demo-segment/active/activity/transit/txntracker/demo-segment/active/time/transit/txntracker/demo-segment/history/activity/transit/txntracker/demo-segment/history/time/transit/txntracker/demo-segment/error/activity/transit/txntracker/demo-segment/error/time
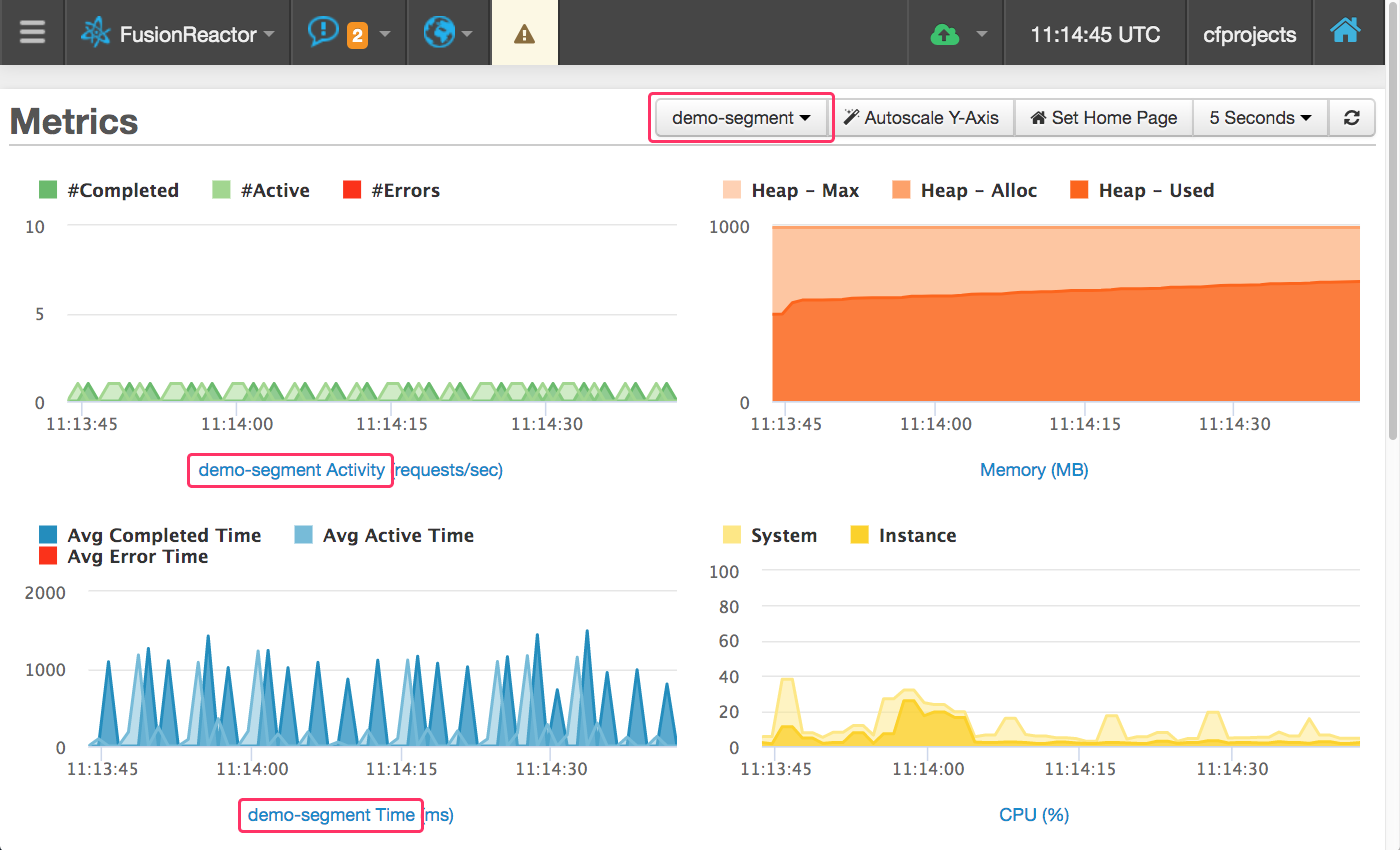
Because of these metrics, we can graph the sub-Transaction, demo-segment, in the Standalone dashboard:
In order to do the same thing with the Cloud dashboard, we have to explicitly enable the aforementioned metrics to be streamed to the Cloud. To see this in action, I've created a simple CFML page that creates a tracked-Transaction and then calls, .enableCloudMetric(), on 4-of-the-6 implicitly-created metrics:
<cfscript>

	// Get the running FusionReactor API (FRAPI) instance from the FRAPI factory class.
	// --
	// Java Docs: https://www.fusion-reactor.com/frapi/8_0_0/com/intergral/fusionreactor/api/FRAPI.html
	frapi = createObject( "java", "com.intergral.fusionreactor.api.FRAPI" )
		.getInstance()
	;

	// ------------------------------------------------------------------------------- //
	// ------------------------------------------------------------------------------- //

	// By default, FusionReactor will use the name of the application as defined in the
	// Application.cfc ColdFusion framework component. However, we can set the name
	// programmatically.
	frapi.setTransactionApplicationName( "FRAPI-Testing" );

	// By default, FusionReactor will calculate the transaction name based on the request
	// context. It actually "understands" the fact that we're using Framework One (FW/1)
	// in production and uses the "action" value as the transaction name. That's the
	// beauty of using an APM product that is embedded within the ColdFusion and CFML
	// community. That said, we can set the transaction name programmatically.
	// --
	// See Framework Support: https://www.fusion-reactor.com/support/kb/frs-431/
	frapi.setTransactionName( "testing-cloud-transaction-metrics" );

	// ------------------------------------------------------------------------------- //
	// ------------------------------------------------------------------------------- //

	try {

		// Let's explicitly wrap a segment of our code in a custom, tracked transaction.
		// This way, we can see how this code executes in the context of parent request.
		subtransaction = frapi.createTrackedTransaction( "demo-segment" );

		// When a custom Transaction is explicitly created in the ColdFusion code,
		// FusionReactor sends the Transaction data to the CLOUD dashboard; however, by
		// default, it doesn't send the METRICS about that Transaction to the CLOUD
		// dashboard. This means that we can see the Transaction in the Tracing and the
		// data-tables; but, we can't graph it in our custom graphs. In order to do this,
		// we have to explicitly set the Transaction-related metrics to be cloud-enabled.
		frapi.enableCloudMetric( "/transit/txntracker/demo-segment/active/activity" );
		frapi.enableCloudMetric( "/transit/txntracker/demo-segment/active/time" );
		frapi.enableCloudMetric( "/transit/txntracker/demo-segment/history/activity" );
		frapi.enableCloudMetric( "/transit/txntracker/demo-segment/history/time" );
		// frapi.enableCloudMetric( "/transit/txntracker/demo-segment/error/activity" );
		// frapi.enableCloudMetric( "/transit/txntracker/demo-segment/error/time" );

		sleep( randRange( 500, 1500 ) );

	} finally {

		subtransaction.close();

	}

</cfscript>

<!--- ------------------------------------------------------------------------------ --->
<!--- ------------------------------------------------------------------------------ --->

<script>

	// Simulate regular throughput / traffic to this endpoint by refreshing.
	setTimeout(
		function() {
			window.location.reload();
		},
		1000
	);

</script>
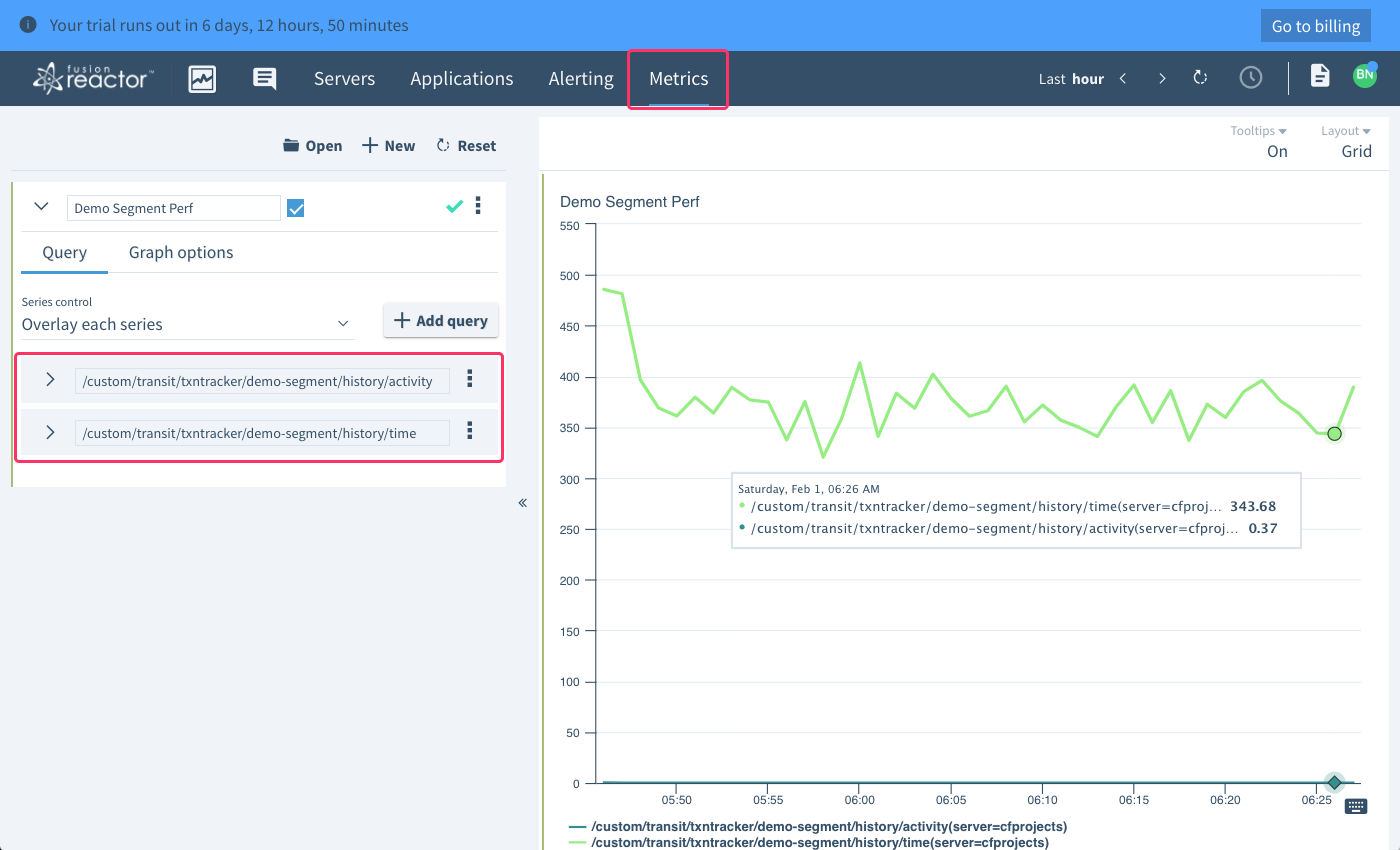
Every 60-seconds, metrics in the local FusionReactor instance are aggregated and sent to the Cloud. So, once this demo-page has been running for a while, and the metrics have been sent to the Cloud, and have had time to get processed by the metrics-ingress, we should be able to find the following metrics in the custom-Graph tooling:
NOTE: I'm including the "error" metrics below, even though I didn't enable them for the Cloud in my demo code. I'm including them for documentation / completeness purposes.
/custom/transit/txntracker/demo-segment/active/activity/custom/transit/txntracker/demo-segment/active/time/custom/transit/txntracker/demo-segment/history/activity/custom/transit/txntracker/demo-segment/history/time/custom/transit/txntracker/demo-segment/error/activity/custom/transit/txntracker/demo-segment/error/time
Notice that each of the metrics has been automatically prefixed with, /custom/:
NOTE: Part of the reason that I spent 3-hours with Michael Flewitt is because not all of the metrics were consistently showing up for me. And, in fact, even as I write this, I don't see all of the metrics being logged in this demo. This appears to be either a bug in the rendering code; or, a timing issue with the metrics-ingress processing.
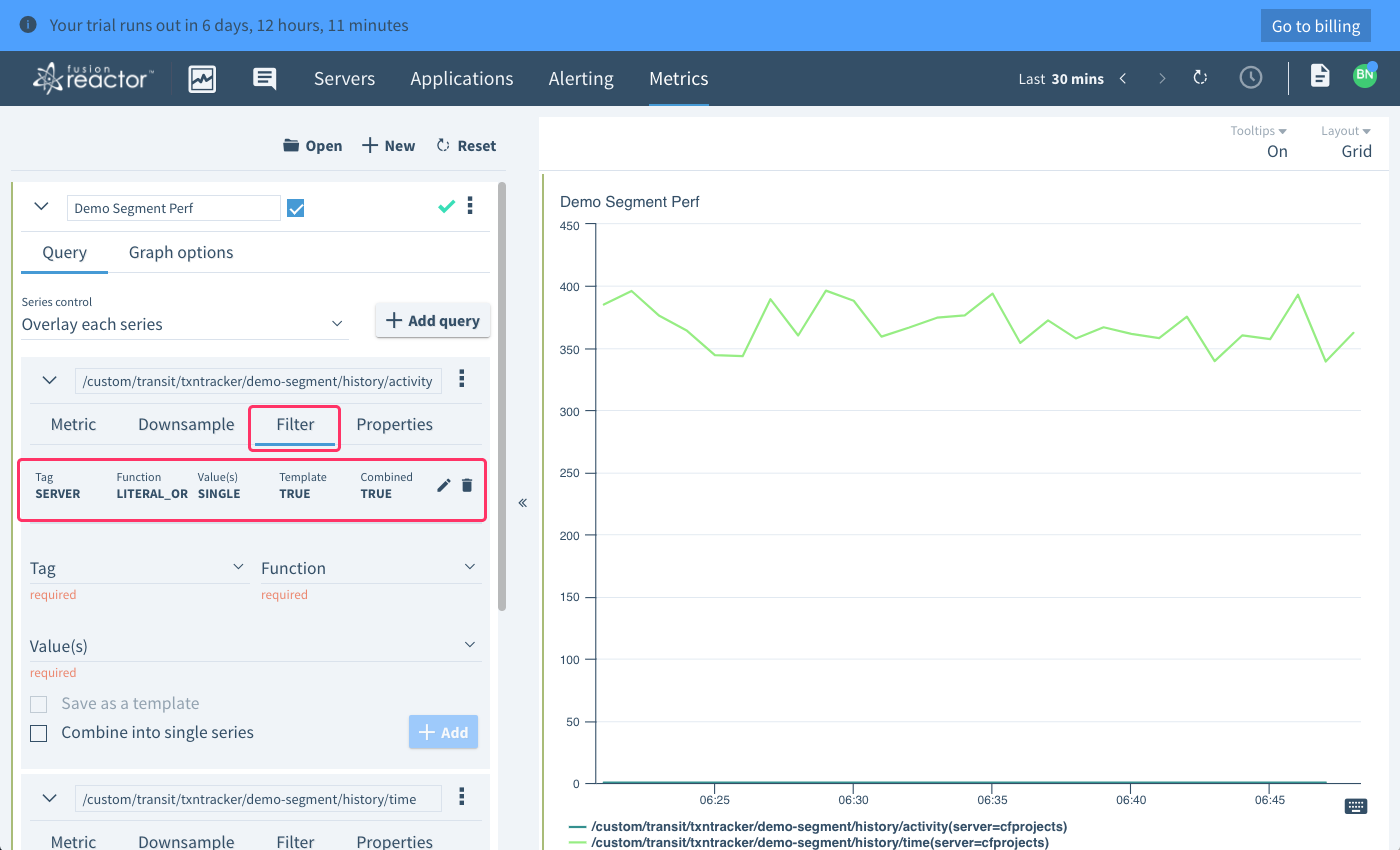
At this point, I can graph my sub-Transactions metrics in the Metrics section of the Cloud dashboard; but, I can't add it to any of my Server performance graphs. In order to do this, I have to add Filtering to the query and then save the graph as a Server Template using the literal_or function:
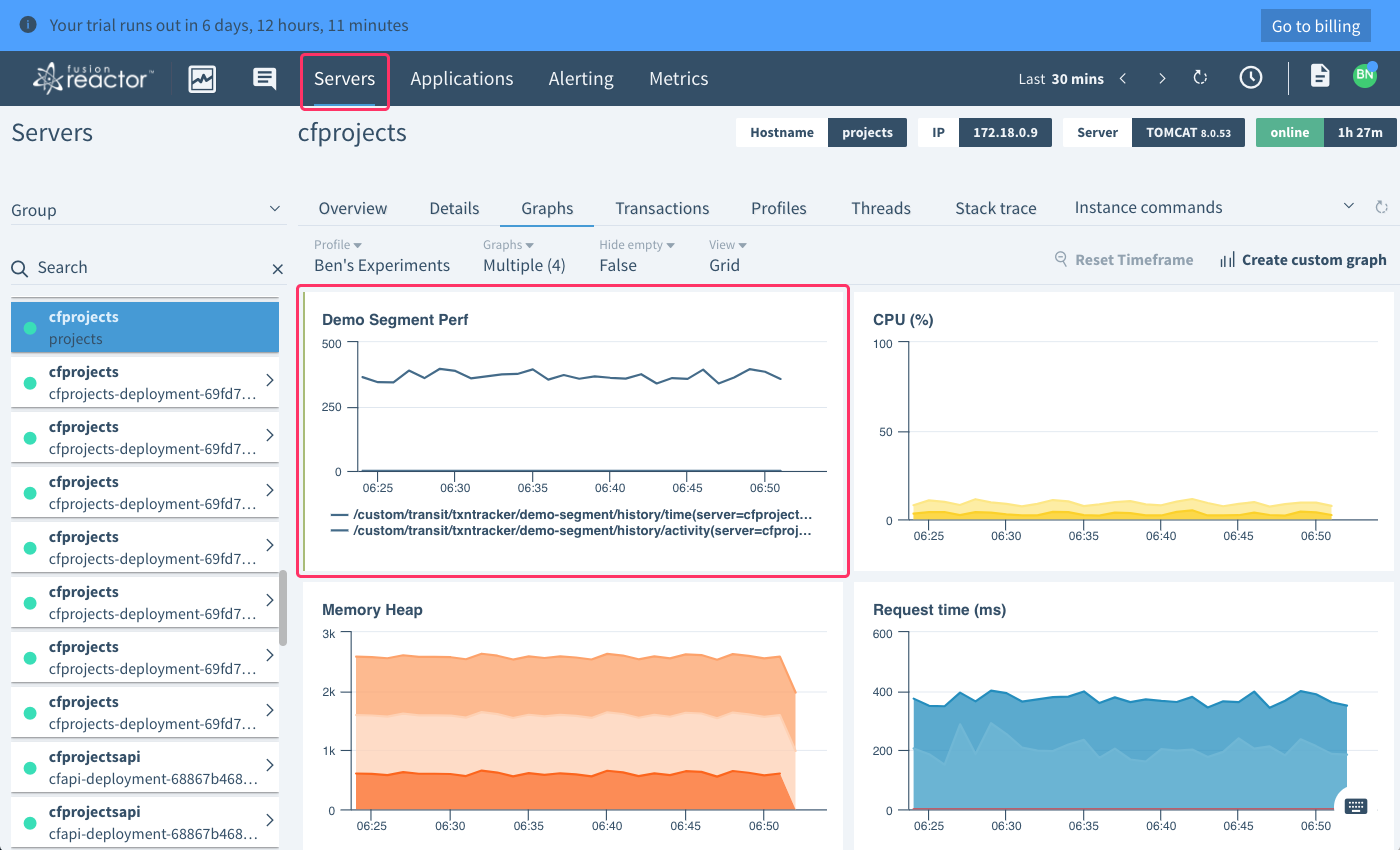
Once I do this (and add the graph to my metric's "Profile"), I can then find the Demo Segments graph in the Graphs section of my server performance monitoring:
Hopefully this is somewhat helpful for anyone else who might be using FusionReactor with their Lucee CFML code; and, is using the Cloud dashboard, not the Standalone dashboard.
Cloud Metrics is a Bit of an Uphill Battle
I am loving FusionReactor's out-of-the-box functionality; but, to be honest, working with custom metrics has been an uphill battle. I am sure that a lot of this is my unfamiliarity with the tooling. But, some of the battle revolves around the stability of the platform. Some points of friction:
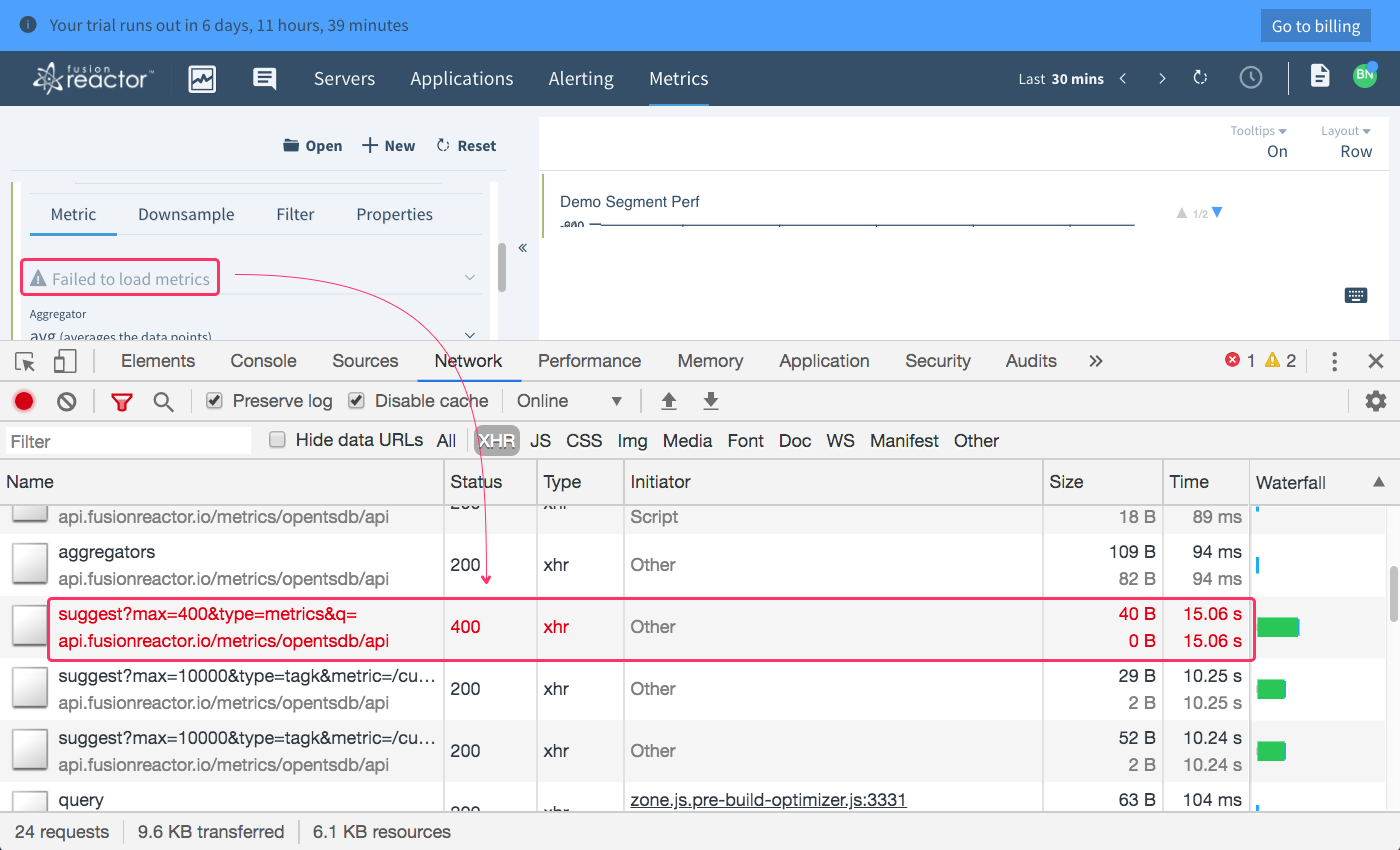
The "Metrics" dropdown menu in the Query configuration fails to load like 90% of the time. Which means that creating a simple graph involves several minutes of page-refreshing in an attempt to get the "Metrics" dropdown to load.
The custom metrics which I am enabling in my code often don't show up in the "Metrics" dropdown. Which means, even when the dropdown finally loads (see point above), my metrics are not there.
The "Filter" configuration only seems to load if the "Metrics" also loaded. And, since the Metrics fail to load most of the time (see above point), I can't add Filtering to my queries.
The Filtering functionality is confusing. For example, why do I even have to add filtering for "transaction related" metrics? If a Transaction can only ever be created as part of a running application (on a server), why do I have to explicitly identify the metric as a "Server template"? It would be great if all transaction-related metrics were defaulted as server templates.
The difference between a "Graph" and a "Profile" took me a while to understand. I think this is more of a user-interface (UI) problem than anything else. Since Graphs and Profiles are created and updated in the same place, the optionally-hierarchical relationship between the Profile and the graphs that the Profile renders is not immediately obvious. Maybe I'll make a demo of how this now that I think I finally get it.
I've discussed some of these issues with the FusionReactor support team and they are looking into it. For example, in the future, I won't have to explicitly enable "cloud metrics" for sub-Transactions - that will just automatically happen.
While I've had some friction with the Cloud Metrics, I do want to be clear that I am loving FusionReactor. I've been living in it for the past week and have already identified a multitude of performance issues in my ColdFUsion code. In fact, my JIRA backlog of performance-related tickets is getting a bit overwhelming - there's only so many hours in the day.
Want to use code from this post? Check out the license.
Reader Comments