Tracking Feature Flags In New Relic And NRQL Using The Java Agent In Lucee CFML 5.3.3.62
Over the last few years, I've talked a lot about how much I love using LaunchDarkly feature flags. Feature flags have completely changed the way that we deploy changes here at InVision. One of the common use-cases we have for feature flags is to add code that we think will lead to a performance improvement. Of course, in order to determine whether or not our optimizations are working, we need to be able to see how they handle real-world traffic. For that, we currently use New Relic. And, to differentiate the existing traffic from the "optimized" traffic, I've found it helpful to track my feature flag state along with the New Relic Transactions using the Java Agent and Lucee CFML 5.3.3.62.
I've already looked at how to instrument your Lucee CFML code using New Relic's Java Agent. As such, I'm not going to dive into the mechanics of the instrumentation itself. For the purposes of this demo, let's just assert that there is an .addCustomParameter() method on the Java Agent's API that takes a Key and a Value:
NewRelic.addCustomParameter( key, value )
When we call this method, the New Relic Java Agent adds the given key-value pair onto the Transaction. These key-value pairs can then be seen in Transaction Traces and accessed using NRQL (New Relic Query Language).
When testing out a given feature flag, we can track its state as a Transaction parameter. Then, we can inspect the performance benefits (or drawbacks) of said feature flag in New Relic.
To see this in action, I've created a simple Framework One (FW/1) controller that randomly assigns a feature flag to the incoming request. And then, randomly assigns better performance to the logic branch with the feature flag enabled. The request logic is defined in the .default() method of the following ColdFusion component:
component
	output = false
	accessors = true
	{

	// Define properties for dependency-injection.
	property javaAgentHelper;

	// ---
	// PUBLIC METHODS.
	// ---

	/**
	* I render the demo for the New Relic feature-flag tracking.
	*
	* @rc I am the FW/1 request context.
	*/
	public void function default( required struct rc ) {

		var isFeatureEnabled = shouldUseFeature( userID = 1 );

		// Now that we know if the feature-flag is enabled, we're going to track the
		// feature flag state as a TRANSACTION PARAMETER using the New Relic Java Agent.
		// This way, we can differentiate requests by feature-flag in our Transaction
		// traces and NRQL (New Relic Query Language) queries.
		javaAgentHelper.addCustomParameter(
			"features.DemoOptimization",
			booleanFormat( isFeatureEnabled )
		);

		// DEMO LOGIC: For the purposes of the demo, we're going to randomly assign
		// better performance to the branch with the feature enabled. This way, we
		// should be able to see a difference in New Relic's Insights dashboards.
		if ( isFeatureEnabled ) {

			sleep( randRange( 50, 150 ) );

		} else {

			sleep( randRange( 100, 1000 ) );

		}

	}

	// ---
	// PRIVATE METHODS.
	// ---

	/**
	* I determine if the feature should be enabled for the given user.
	*
	* @userID I am the user being tested.
	*/
	private boolean function shouldUseFeature( required numeric userID ) {

		// FOR THE DEMO, we are going to randomly enable or disable the given feature.
		// This way, we can see the difference in the New Relic transactions.
		// --
		// NOTE: This is the logical equivalent of a 50% feature roll-out.
		return( !! randRange( 0, 1 ) );

	}

}
As you can see, once we determine whether or not the feature flag is enabled for the current user, when then add the feature flag state as the Transaction parameter, features.DemoOptimization. At this point, we can go into the Insights product within New Relic and look at the relative performance of our two different execution branches.
First, let's look at how many requests are currently experiencing the new feature flag logic. For that, we can write a NRQL query that groups the requests by features.DemoOptimization state:
SELECT
	count( * )
FROM
	Transaction
WHERE
	appName = 'local-cfprojects-bennadel'
AND
	resourceUri = '/d/ben/default'
SINCE
	 10 minutes ago
FACET
	features.DemoOptimization
TIMESERIES
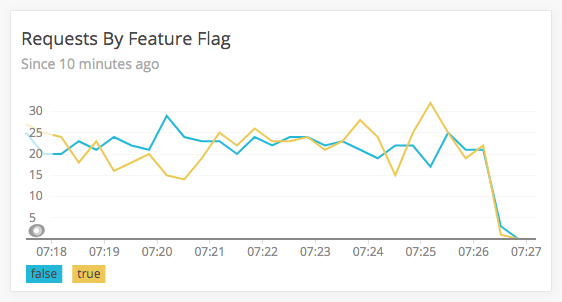
In NRQL, the FACET keyword is akin to SQL's GROUP BY. And, the TIMESERIES keyword tells New Relic to graph the results over time instead of reporting the values as a single aggregate. And, the SINCE limits the scope of the query based on a given time-frame. Now, when we run the above NRQL, we get the following output:

As you can see, roughly half of all incoming traffic is experiencing the new feature-flag-based logic (due to our randRange(0,1) mock roll-out). But, is the new logic performing better? For that, we can write another NRQL query that breaks-down the request duration by feature flag state:
SELECT
	average( duration )
FROM
	Transaction
WHERE
	appName = 'local-cfprojects-bennadel'
AND
	resourceUri = '/d/ben/default'
SINCE
	10 minutes ago
FACET
	features.DemoOptimization
TIMESERIES
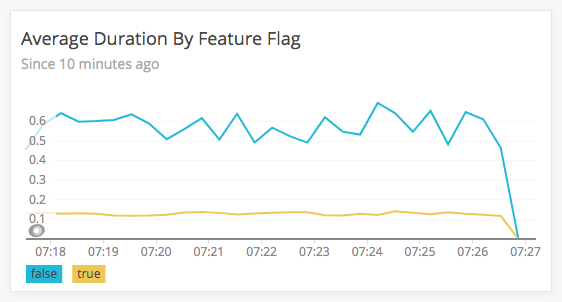
Once again, the FACET keyword in NRQL is akin to SQL's GROUP BY query and should give us two graph lines: one with the features.DemoOptimization set to "true" and one with it set to "false". Now, when we run the above NRQL query, we get the following output:

As you can see, the Transactions with the feature flag enabled are performing much better than the Transaction with the feature flag disabled.
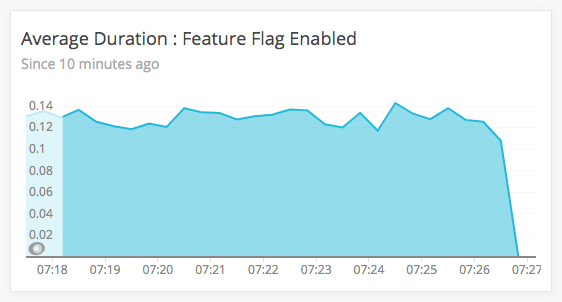
Of course, we can do more that group-by (FACET) the Transaction parameters - we can drill down into specific states. For example, if we want to see the average duration for Transactions that have the feature flag enabled, we could query for a particular features.DemoOptimization value:
SELECT
	average( duration )
FROM
	Transaction
WHERE
	appName = 'local-cfprojects-bennadel'
AND
	resourceUri = '/d/ben/default'
AND
	features.DemoOptimization = 'true'
SINCE
	10 minutes ago
TIMESERIES
Here, where limiting our NRQL query specifically to requests that were assigned a features.DemoOptimization value of 'true'. And, when we run the above NRQL query, we get the following output:

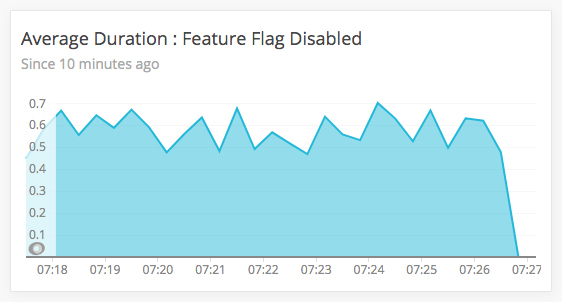
And, of course, we could run the same NRQL query for requests in which the feature flag was disabled:
SELECT
	average( duration )
FROM
	Transaction
WHERE
	appName = 'local-cfprojects-bennadel'
AND
	resourceUri = '/d/ben/default'
AND
	features.DemoOptimization = 'false'
SINCE
	10 minutes ago
TIMESERIES
Which gives us the following output:

As you can see, adding custom Transaction parameters to a New Relic request gives us some pretty exciting insights; and, allows us to pick-apart our performance metrics with granular control. So, you might be asking yourself: Shouldn't I just dump all of my feature flags in to the New Relic Transactions? That's a fun thought; however, New Relic Transactions have limits. According to the documentation:
Transaction: Limited to 64 user attributes.
Attribute key: Limited to 256 bytes each. If the key is more than 256 bytes, then the attribute will not be recorded.
Attribute value: Limited to 256 bytes each. If the value is greater than 256 bytes, then the attribute value will be truncated.
At InVision, we have hundreds of feature flags. As such, blinding dumping all feature flags into each New Relic Transaction would cause issues (quickly surpassing the 64-attribute limit). Therefore, at least for our teams, we have to selectively add feature flags as Transaction parameters when we want to examine the affects of a specific feature flag. Luckily, this is quite an easy task using the Java Agent in our Lucee CFML code.
ASIDE: I wanted to give a special shout-out to Sean Roberts, who has really helped me get comfortable with New Relic's NRQL syntax. At first, it was very intimidating. But, after a few screen-shares, I've really started to enjoy it.
Want to use code from this post? Check out the license.

Reader Comments