Adding Event Support For My DataDog / DogStatsD ColdFusion Component
Yesterday, I released an update for my ColdFusion StatsD client - StatsDGateway.cfc - that included the metrics-based extensions offered by DataDog and DogStatsD. That update was specifically done for Tagging and the new Histogram metric type. This morning, I'm releasing another minor update that adds the "events" extension for DogStatsD. The events extension allows arbitrary events to be reported to DataDogHQ, where they can mapped over dashboards graphs. This enables engineers to be able to correlate changes in system behavior (such as decreased performance or increased error rate) with system events (such as deployments or cache invalidation).
View the StatsDGatway.cfc project on my GitHub account.
This update adds the event() method to the DogStatsDClient.cfc ColdFusion component. The event() requires the Title and Text arguments (which can be just about anything); but, it also allows for a number of categorization arguments that can help refine the event searches in DataDogHQ:
- title - Required. I am the title of the event.
- text - Required. I am the text of the event (can be empty and can contain line breaks).
- timestamp - I am the UTC seconds of the event (default is now).
- hostname - I am the hostname of the event.
- aggregationKey - I am the shared aggregation key of the event (allowing events to be grouped).
- priority - I am the priority of the event (default is "normal").
- sourceTypeName - I am the source type of the event.
- alertType - I am the alert level of the event (default is "info").
- tags - I am the collection of tags associated with the event.
One thing that tripped me up when coding the event() method is that the timestamp needs to be in UTC seconds, not UTC milliseconds. Personally, I don't understand why any system ever deals with seconds? Perhaps it's just my limited programming background; but, it always seems like the milliseconds value is the most accessable to the programmer (getTickCount() in ColdFusion and Date.now() in JavaScript and Node.js).
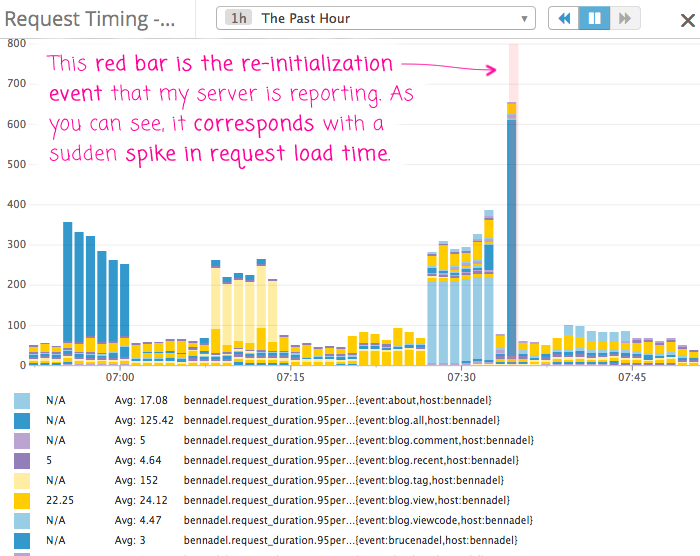
Once you start reporting events to DataDogHQ, they can then be graphed in your dashboards as red bars. In my case, I'm emitting an event whenever my application is reset (either from a reboot or from a manual re-initialization):
| |
|
|
||
| |
 |
|
||
| |
|
|
As you can see in my 95percentile response time graph, there is a sudden spike in request load time when I reinitialize my site. This is because reinitialization flushes the component and content cache, causing more processing and cache-warming for subsequent requests. This is to be expected; and, because I can now correlate application events with application performance, I can properly curate any cause for concern.
Honestly, it feels a little weird that this new event() method is part of DogStatsD. It doesn't feel sufficiently related to metrics. As far as I can see, the only common thread between the two is that events - like metrics - get reported over UDP (User Datagram Protocol) and not HTTP (HyperText Transfer Protocol). That said, I suppose if you squint hard enough, an emitted event can be seen as a "metric".
Anyway, once I add Service Checks - the final extension for DogStatsD - I can come back and refactor and reorganize the code.

Reader Comments
@All,
Rounding out my DogStatsD compliance with the .serviceCheck() method, which allows systems to report service health back to DataDogHQ:
www.bennadel.com/blog/3338-adding-service-check-support-for-my-datadog-dogstatsd-coldfusion-component.htm
I don't know too much about it yet, but it can be used to monitor and send alerts. Pretty cool stuff!