Google Chrome Will Automatically Retry Requests On Certain Error Responses
The other day, when I was trying to understand how the Node.js Cluster module reacts to Worker process disconnects, I was seeing some baffling behavior in my error logging. For every request that I was making to the Node.js server, I was seeing three errors show up in my console. At first, I thought it was a problem with my code; but, eventually, I realized that the Google Chrome browser was performing automatic retry attempts when it received an ERR_CONNECTION_REFUSED response or an ERR_EMPTY_RESPONSE response. The thing that tipped me off to this - aside from the unique Worker PIDs - was the fact that Google Chrome won't exhibit this behavior if the Dev Tools are open.
NOTE: I saw this behavior with the ERR_CONNECTION_REFUSED and ERR_EMPTY_RESPONSE errors; though, there's no reason to assume that this is an exhaustive list of errors that exhibit this behavior.
This behavior can be easily reproduced with a simple Master / Worker configuration in which the Worker process exits-out immediately upon receiving a request:
| // Require the core node modules. | |
| var chalk = require( "chalk" ); | |
| var cluster = require( "cluster" ); | |
| var http = require( "http" ); | |
| var os = require( "os" ); | |
| // ----------------------------------------------------------------------------------- // | |
| // ----------------------------------------------------------------------------------- // | |
| // MASTER PROCESS. | |
| // -- | |
| // The Master process, in the cluster module, is responsible for spawning child- | |
| // processes that all share the same port-listening. The Master will round-robin (on | |
| // most systems) requests to the child / worker processes. | |
| if ( cluster.isMaster ) { | |
| console.log( chalk.red.bold( "[Cluster]" ), "Master is now running.", process.pid ); | |
| // Ensure that there are at least 2 workers to enable redundancy and availability. | |
| // This way, if one process dies, there should always be another process ready | |
| // to take on work. | |
| var concurrencyCount = Math.max( 2, ( process.env.WEB_CONCURRENCY || os.cpus().length ) ); | |
| // Spawn child / worker processes. | |
| for ( var i = 0 ; i < concurrencyCount ; i++ ) { | |
| cluster.fork(); | |
| } | |
| // Listen for Worker process death. | |
| cluster.on( | |
| "exit", | |
| function handleExit( worker, code, signal ) { | |
| console.log( chalk.red.bold( "[Cluster]" ), "Worker has exited.", worker.process.pid ); | |
| } | |
| ); | |
| // WORKER PROCESS. | |
| // -- | |
| // The Worker process, in the cluster module, is responsible for implementing the actual | |
| // request handling for the application. Each Worker is a completely separate instance | |
| // of the application and shares no memory with either the Master or the other Workers. | |
| } else { | |
| console.log( chalk.red( "[Worker]" ), "Worker has started.", process.pid ); | |
| // Setup the application server. | |
| http | |
| .createServer( | |
| function( request, response ) { | |
| // For this demo, we're just going to exit the Worker immediately so we | |
| // can see how the Browser reacts to this type of failure. | |
| // -- | |
| // NOTE: Produces the ERR_CONNECTION_REFUSED error response. | |
| process.exit( 1 ); | |
| // NOTE: If we threw an uncaught error, instead of exiting, we'd get | |
| // the ERR_EMPTY_RESPONSE error response. | |
| } | |
| ) | |
| .listen( 3000 ) | |
| ; | |
| } |
As you can see, the Master process simply spawns Worker processes and then listens for process death. The Worker process, on the other hand, sets up the HTTP servers and then exists-out immediately upon request.
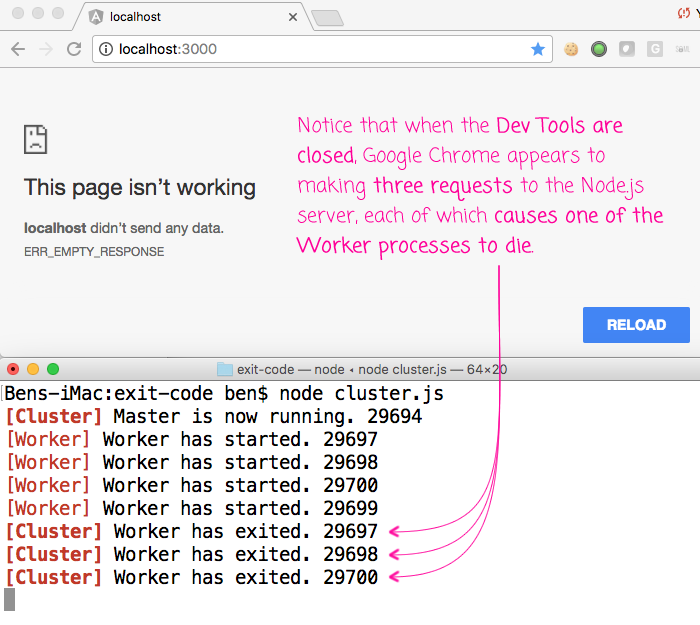
Now, if we run this in Google Chrome with the dev tools closed, we see the following behavior exhibited:

As you can see, the Google Chrome browser appears to be making automatic retry requests when the Node.js server fails to return a response. In this case, the first request fails and then Google Chrome makes two more requests.
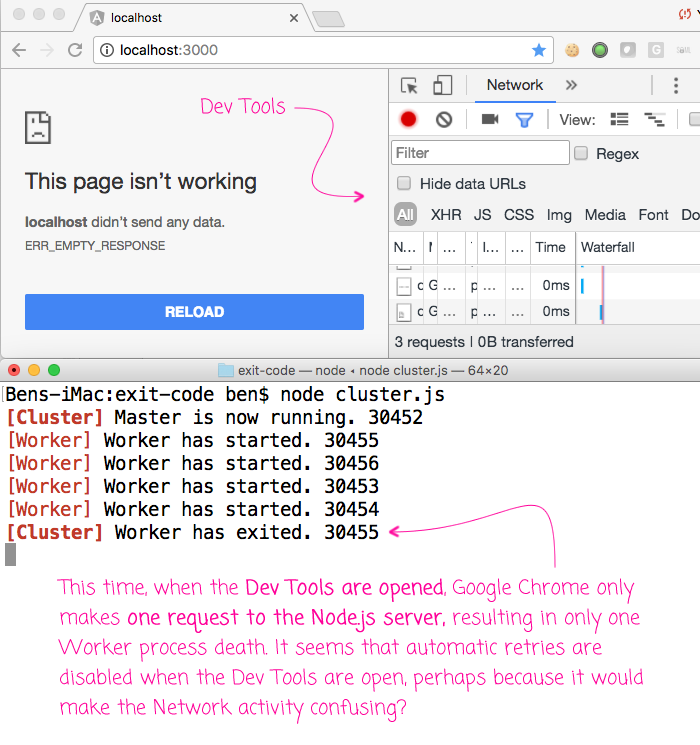
Now, if we open the Dev Tools and run the same demo, we get different behavior:

As you can see this time, when the Dev Tools are open, the Google Chrome browser only makes a single request to the Node.js server, causing only one of the Worker processes to die. Perhaps this is a setting somewhere in the Dev Tools configuration. Or, perhaps the browser does this so as to not make the Network activity tab confusing.
Anyway, this was basically just a short "Note to Self" so I can better understand and remember why I might see unusual request activity in my Node.js error logs. I'm still trying to wrap my head around how Master and Worker processes interact when it comes to process death; but, at least going forward, I'll know to always run my experiments with my Chrome Dev Tools open!
Want to use code from this post? Check out the license.
Reader Comments
Great piece of information. I am facing this Chrome ERR_CONNECTION_RESET Error. Does anyone have any working solution for this error?
https://notresponding.net/chrome-err_connection_reset-error/
@Jason,
In what context are you receiving this error? Are you building a server-side app? A client-side app?