jQuery Selectors - The Firebug Plugin Inserts A Hidden DIV Element
Last night, I was testing out someone's jQuery queue() and dequeue() code and I had a bug that was just driving me crazy; no matter how simple I made my test, my queued callbacks kept firing twice. To give you some insight into how simple my code was, take a look at this demo:
| <!DOCTYPE html> | |
| <html> | |
| <head> | |
| <title>Hidden FireBug DIV</title> | |
| <script type="text/javascript" src="jquery-1.4.2.js"></script> | |
| <script type="text/javascript"> | |
| // When the DOM is ready, interact with DOM. | |
| $(function(){ | |
| // Get our testing DIV. | |
| var div = $( "div" ); | |
| // Create and add a callback to your div's queue. | |
| div.queue( | |
| "testQueue", | |
| function( next ){ | |
| // Simply log that the callback has fired. | |
| console.log( "Queued item fired!" ); | |
| } | |
| ); | |
| // Initiate the dequeuing. | |
| div.dequeue( "testQueue" ); | |
| }); | |
| </script> | |
| </head> | |
| <body> | |
| <h1> | |
| Hidden FireBug DIV | |
| </h1> | |
| <div> | |
| This is my defined div! | |
| </div> | |
| </body> | |
| </html> |
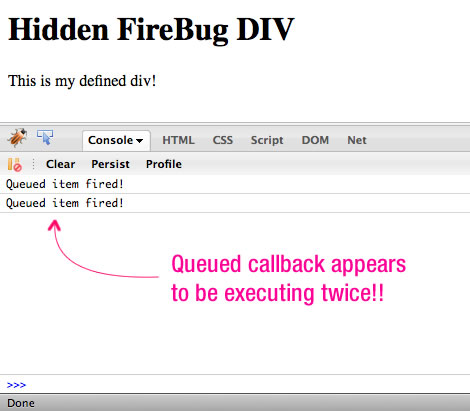
As you can see, there's almost nothing going on here; when the DOM is ready, I grab the one defined DIV element, queue up a single callback, and then initiate its dequeuing. I'd expect the single queued callback to execute and be done with it. When I run this code, however, I get the following console output in Firebug:

As you can see, jQuery appears to be executing my queued callback twice.
This behavior had me stumped for a good 15 minutes. I tried everything from rewriting the entire demo to searching through the jQuery source code for a queuing bug. Then, finally, I had to the bright idea to double-check the jQuery collection on which I was acting. To do this, I went into the Firebug runtime command line and executed my jQuery selector:
| $( "div" ); |
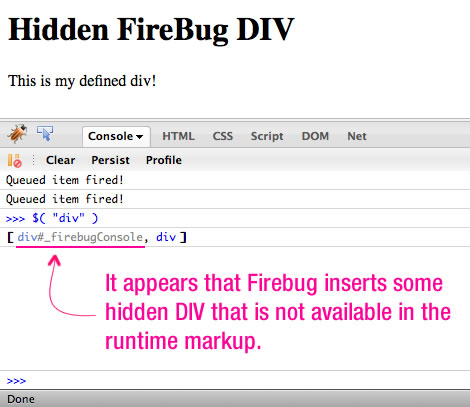
When I did this, I got the following output:

As you can see, when we query the DOM for our "DIV" element, we get back our explicitly defined node plus a hidden one that is added by the Firebug plugin. What's odd is that I can't find that Firebug DIV anywhere in the markup. When I log its parent element, I get "HTML"; however, when I inspect the runtime markup, there is nothing but a HEAD and BODY tag contained within the HTML.
NOTE: This happens regardless of whether or not the Firebug console is actually open.
Normally, this would not be a problem since we very rarely query the DOM for an unqualified DIV element; however, when testing code, it's definitely going to be good to know that Firebug is adding its own hidden markup to the DOM tree.
Want to use code from this post? Check out the license.
Reader Comments
Another reason to use Chrome. ;)
Wow .. this is some really useful information .. Thanks for the heads up ! :)
@Ray,
I use Chrome for a lot of stuff since it is so much nicer on RAM use and crash prevention. But for development, I just *love* Firebug :)
@Karol,
No problem - I was definitely banging my head against the wall for a few minutes there.
As far as I can tell from my understanding Firebug codebase.
Some nodes in the DOM are marked as hidden to Firebug UI (HTML panel, etc.). One example is this _firebugConsole, another is helper DIVs to visualize manual element picking for inspection.
Yes, it may interfere with your page/code in some rare cases. But there was probably no better way how to implement those features. Firebug guys are not code Firefox developers, so they just cannot simply add features/APIs they need for Firebug.
Not to mention that it probably helps them maintain the Firebug lite plugin to keep the features available for both the full firebug and for the lite at the same time.
@Antonin,
Good point about the inspector DIVs as well; I never knew how they did that, but it makes sense. I'm not suggesting that Firebug change the way they do things - as you said, it's just a plugin, not a core Firefox feature. I'm just happy to know how it works so I can work around it.
@Todd,
Firebug light is an "interesting" beast unto itself :)
It has saved my ass more than once when trying to debug something in IE. :/
@Todd,
I'll agree to that!
I've had this happen before and it drove me a little nutty. (A client was reporting that a "promotion" wasn't added to their homepage, but their anti-virus software was rewriting the HTML.)
Here's what I do now:
Use the Web Developer Addon for Firefox, go to "View Source" and then "View Generated Source" and compare it with "View Source" results (or the actual source). It will allow you to determine if any markup is added or removed by other included third-party scripts, Firefox AddOns (not just Firebug; ie AdBlock, LinkAlert, etc) and anti-virus software proxies.
Plugins, Grease Monkey Scripts and other things can add to the dom as well. Unfortunately, you can't trust that your html hasn't been altered.
Please try Firebug 1.6b1, http://getfirebug.com/releases/firebug/1.6X. We don't need the DIV you see any more. We still need to inject Javascript and elements that support the inspector, but we are working on solutions to remove these eventually as well.
In Chrome try the Dev Tools...
Ctrl + Shift + I
really nice...
I've seen the div insert by the inspector feature so much... but this never complicated me...
i'm agree with ben nadel, i love firefox/firebug for development too...
I've found Firebug Lite in Chrome to do the trick (for the times when the Inspector isn't getting it done).
@James,
Good thinking with the View Generated Source. I'm not sure I even knew that option existed. I think I may have used it before, but I always forget it.
@Joe,
I've definitely been on the "creating" end of GreaseMonkey scripts; but, I haven't used them in a while. If someone is gonna mess with the markup, there's only so much you can control.
@John,
I'll definitely check out the new FireBug. I love this tool; don't get me wrong - I'm not too concerned about the DIV. After all, I wouldn't normally query the DOM for unspecified tags.
@Franky,
Yeah, people have been telling me that Chrome dev tools are pretty good. I use Chrome a lot, but the dev tools just don't seem to be as easy to use. Maybe I just need to get over that learning curve.
@Acaz,
Exactly - it's a rare case to ever query the DOM for simply, "div." Typically I am using a class or ID selector or a contextual selector.
@Jyoseph,
I've used FBLite in IE for some success. I never thought of using in a browser that has its own development tools.
I was under the assumption that the Inspector did not show XHRs like Firebug does. Maybe it's in there, but I've never been able to find it in the inspector. The console in Firebug shows it clearly. That's really the only reason why I still occasionally use Firebug Lite in Chrome.
Example: http://i55.tinypic.com/24v1ik9.png
@Jyoseph,
Yeah, I think it would be hard for a non-plugin to listen to HTTP requests. Unless there's an event you can bind to (which I don't think there is), I would think you'd have to be part of the core product/plugin-architecture to gain access to that.
Also check out this great resource on creating your own jQuery selectors: http://www.websanova.com/tutorials/jquery/12-awesome-jquery-selector-extensions